
Executive summary
2012-2016
The tropical Andes are among the most biodiverse areas on the planet. The human societies that live there depend in many ways on the different goods and services provided by Andean ecosystems, with their countless species.
The integrity of these ecosystems is seriously threatened by climate change and changes in land use. Both factors are expected to have a profound impact on the survival, geographic distribution, and ecological interactions of numerous Andean species. As a result of the disintegration of these ecosystems due to such impacts, their capacity to provide vital goods and services to humans is expected to decline. Therefore, the tropical Andes need conservation strategies adapted to their rapidly changing environment, and it is necessary to develop others, such as adaptive management schemes, to address the impacts of climate change on biodiversity, ecosystems, and human well-being.
Project
The IAI, with support from the John D. and Catherine T. MacArthur Foundation, sought to provide the countries of the tropical Andes—Bolivia, Colombia, Ecuador, and Peru—with a standard methodology for estimating, at the local level, the effects of climate change on biodiversity.
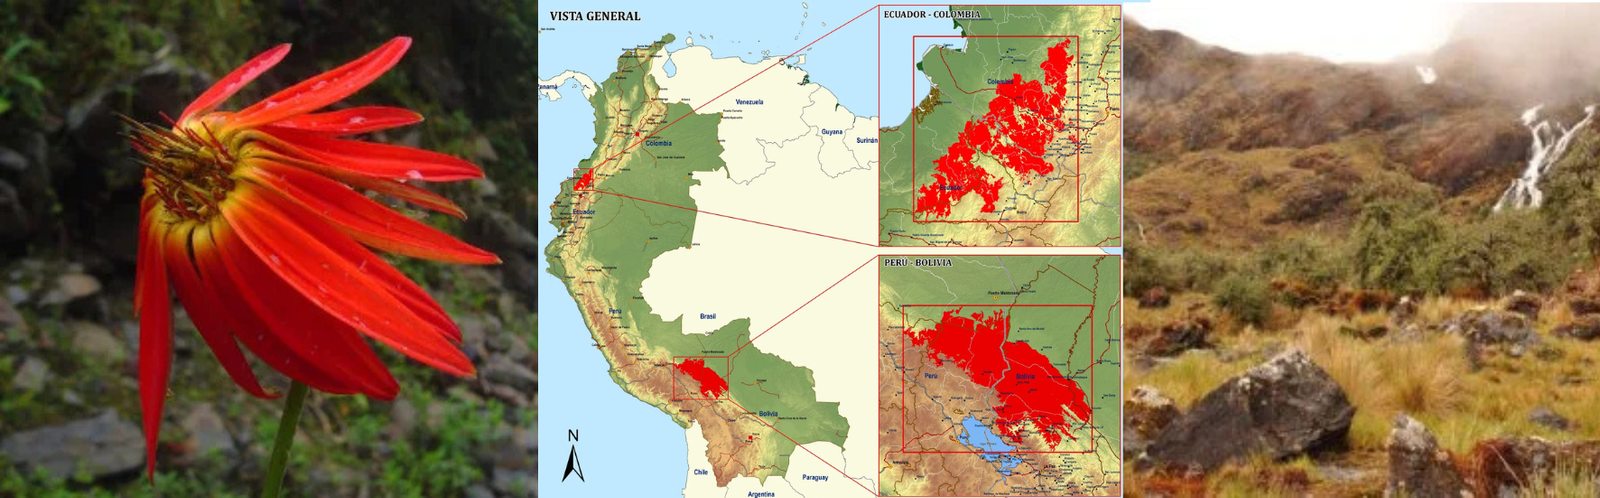
The objective of the five-year project (2011 to February 2016) is to conduct case studies on short- and medium-term climate change trends, biodiversity patterns and gradients, and the vulnerability of species and ecosystems to climate change, as well as changes in land use in two cross-border areas under study: the Pacific slope of the Northern Andes, in the border area between Colombia (department of Nariño) and Ecuador (provinces of Carchi, Esmeraldas, and Imbabura); and the Amazonian slope of the Central Andes, in the border area between Bolivia and Peru (Madidi and Apolobamba protected areas in Bolivia, Bahuaja-Sonene and Tambopata in Peru).
The studies and standard methodology developed in this project contribute to vulnerability and adaptation analyses in the region and to the development of new conservation strategies that prioritize adaptive measures appropriate to each situation.

The Tropical Andes

AST Mutisia Lanata

Deltochilum carinatum

Canastero Asthenes urubambensis

General view- The Tropical Andes
Methodology
Climate and climate change
The analysis of changes in climatic conditions took into account various sources of information, including simulation results from five global climate models, historical data from weather stations located at each site, and climate reconstructions from distant historical periods using tree rings from key tree species. Combining the first two sources mentioned above has advantages. Models provide continuous information for the entire planet over several decades, but it is not real information. Weather stations, on the other hand, provide real information, but it is localized to a single point and covers time horizons that do not exceed 30 to 40 years. By combining both sources of information, it is possible to calibrate the simulation models and correct their results, thereby obtaining much more reliable information from their climate projections. This is particularly important in the context of the tropical Andes, where historical information from weather stations is limited or, in some cases, non-existent, and where the complex topography requires even more cautious analysis of climate model simulation results. The third source of information, obtained through climate reconstructions, makes it possible to extend the horizons of analysis considerably into the past, providing an even more representative window of analysis of a long-term phenomenon such as climate change.
– More information on ‘Climate and climate change’ here (in Spanish)
Biodiversity
The classification of ecosystems used in the project was based on the Atlas of Ecosystems of the Northern and Central Andes published by the General Secretariat of the Andean Community, as it is a regional classification that covers the entire tropical Andes. Ecosystems are extremely complex environments that include thousands of species of bacteria, plants, fungi, and animals. They interact with each other and with the physical environment in which they are found in many different ways. In the tropical Andes, our knowledge of existing ecosystems is still in its infancy in many cases. These limitations prevent the application of complex, recently developed tools that directly assess the vulnerability of habitats or ecosystems.
Assessing the vulnerability of certain key species to climate change is an indirect way of obtaining reliable guidelines on the vulnerability of the ecosystems to which they belong. For some taxonomic groups, our knowledge of the distribution, natural history, and ecology of their species in the tropical Andes is sufficiently detailed to facilitate such an assessment. The following criteria should be considered when selecting key taxonomic groups: (1) they should be relatively well known taxonomically and ecologically; (2) they must be ecologically important; (3) they must behave as bioindicators with an optimal cost-benefit ratio; (4) they must encompass a significant but manageable number of species; and (5) they must have been previously studied or inventoried in the area under consideration.
Three taxonomic groups were considered to be priority or ideal for assessing the vulnerability of Andean ecosystems to climate change, as they meet all these requirements and also cover a wide spectrum of life forms and biological traits: (1) select groups of plants such as ferns, bromeliads, fabaceae (legumes), and palms; (2) coprophagous beetles; and (3) birds. Plants are the primary producers that form the foundation of ecosystems, while birds and coprophagous beetles have been objectively identified as the taxonomic groups with the best cost-performance ratio among all bioindicators.
Biodiversity information is entered into the tool in the form of maps showing the areas where each of the selected species can be found. The maps can be created using information from scientific collections (museums, herbaria) and previous studies reporting the presence of each species, or new information gathered in the field during technical visits.
The degree of vulnerability of each species is assessed by analyzing various factors corresponding to three key components: exposure (changes in temperature and humidity), sensitivity, and adaptive capacity. Sensitivity factors include, for example, the species’ dispersal capacity and phenological response to changes in prevailing climatic conditions. The assessment of all selected species, via the implementation of the Andean version of NatureServe’s Climate Change Vulnerability Index, allows species to be classified according to their degree of vulnerability. The classification has five categories, ranging from ‘Not vulnerable and with possible increases in spatial distribution’ to ‘Extremely vulnerable’.
– More information on ‘Biodiversity’ here (in Spanish)
Land use
Changes in land use and deforestation activities were quantified by analyzing information (available on the web) provided by satellites on variations in vegetation cover. Specifically, a parameter called NDVI (Normalized Difference Vegetation Index) was of interest, which measures the photosynthetic activity of vegetation. The study of this parameter can be used not only to determine how vegetation responds to normal natural climate variability, but also to analyze plant stress under extreme climatic conditions or in the face of abrupt changes caused by deforestation. The processed information, which covers a time frame of more than three decades (1981 to the present), made it possible to determine the timing and magnitude of significant human interventions in a given area of the territory under study.
Perception of climate change in local communities
Information about perceptions of climate change and the various ways in which this change is affecting ecosystems in the two study areas was collected in rural communities using three methodological approaches: (1) the application of a structured survey to local inhabitants; (2) in-depth interviews with key local informants (men and women); and (3) a participatory mapping exercise with focus groups to identify areas of greatest risk to climate change according to local opinion and opportunities to apply adaptation mechanisms.
Comprehensive analysis of the components
A multi-criteria decision analysis (MCDA) was applied with the aim of integrating the results of the different components of this project (climate change, land use change, biodiversity vulnerability) for an assessment of biodiversity risks at the ecosystem level in the face of global environmental change.
An MCDA matrix provides a score for each ecosystem for each criterion included in the analysis. The following six criteria were included:
(1) The increase in average temperatures projected for 2046-2065.
(2) Changes in the humidity index projected for 2046-2065.
(3) The proportion of the area of each ecosystem that showed statistically significant changes in land use between 1981 and 2006 (expressed by the normalized difference vegetation index – NDVI).
(4) The percentage of plant species vulnerable to climate change according to the CCVI.
(5) The percentage of coprophagous beetle species vulnerable to climate change according to the CCVI.
(6) The percentage of bird species vulnerable to climate change according to the CCVI.
For each criterion, ecosystems were scored on an ordinal scale from 1 to 5 (1 being the lowest degree of severity, 5 the highest), dividing the range of values observed for each criterion into five equal intervals. Each of the six criteria was assigned a relative weight, and the weighted average for each ecosystem was calculated as follows:
– The highest weight (0.4) was assigned to criterion 3 (land use change), as this represents the most immediate and abrupt disturbance to biodiversity.
– A somewhat intermediate weight was assigned to criteria 4, 5, and 6, i.e., the proportion of vulnerable species in each of the three taxonomic groups (0.133 each); when added together, they have the same weight as land use change.
– Finally, the lowest weight was assigned to criteria 1 and 2 (projected changes in average temperature and humidity; 0.1 each), because these have a more long-term effect on ecosystems, and to avoid redundancy since these criteria were already taken into account in the assessment of species vulnerability using NatureServe’s CCVI.
Results
Results of the ‘Climate and climate change’ component
Simulation results for the prospective horizon (2046-2065), corrected to include the complex orography of the Andes, suggest that across much of the tropical Andes, air temperatures could increase by between +2.2 and +2.4°C, which could severely affect the integrity and functionality of its ecosystems. A significant proportion of the Colombia-Ecuador study area could experience a temperature increase of close to +2.0°C, and in some places even +2.2°C. The case of the Peru-Bolivia study area appears to be slightly more critical, as the temperature could increase by up to +2.7°C over a large part of the area.
In terms of changes in humidity, the entire tropical Andes could experience a variation in humidity ranging from -18% (reduction in humidity) to +20% (increase in humidity) in the medium term. The two study areas could experience variations in their historical conditions between -13% and +9%, with humidity reduction being the most prevalent scenario.
The projected increases in average temperature for the Colombia-Ecuador study area showed little variation between different ecosystems, ranging from +1.7°C to +1.8°C, with a slight tendency for higher anomalies at higher elevations. Only one ecosystem was projected to experience an average reduction in humidity of 5%: the piedmont rainforest of the Northern Andes.
For the Peru-Bolivia study area, the largest increases in average temperature exceeding 2.0°C are projected for the four highest-altitude ecosystems, namely the shrublands, grasslands, and high Andean Polylepis forests. Meanwhile, the ecosystems with the greatest projected average reduction in humidity (6-8% desiccation) are the piedmont and sub-Andean forests at the other altitudinal extreme of the study area.
Results of the ‘Biodiversity’ component
For the Colombia-Ecuador study area on the western slope of the tropical Andes, the geographical distribution and vulnerability to climate change of a total of 1,007 species were evaluated among the three taxonomic groups considered in this project: 415 species of vascular plants, 46 species of coprophagous beetles, and 546 species of birds. Species vulnerable to climate change were concentrated in four of the seven ecosystems and in two altitudinal zones: (1) in piedmont forests below 1,500 meters above sea level; and (2) in páramos above 3,000 meters above sea level.
The highest absolute and relative numbers of vulnerable coprophagous beetle and plant species were observed in the piedmont forests. At the other altitudinal extreme, in the páramos, the highest relative representation of vulnerable plants and birds was recorded.
For the Peru-Bolivia study area on the eastern slope of the tropical Andes, the geographical distribution and vulnerability to climate change of a total of 1,581 species were evaluated among the three taxonomic groups considered in this project: 592 species of vascular plants, 150 species of coprophagous beetles, and 839 species of birds. Species vulnerable to climate change were concentrated in seven of the 15 ecosystems and in two altitudinal zones: (1) in the piedmont and sub-Andean forests below 1200-1300 meters above sea level; and (2) in the high Andean shrublands and grasslands above 3000 meters above sea level.
The highest absolute and relative numbers of vulnerable coprophagous beetle species and the highest absolute numbers of vulnerable plants were observed in the piedmont and sub-Andean forests. At the other altitudinal extreme, in the high Andean scrublands and grasslands, the highest absolute and relative numbers of birds were recorded, as well as the highest relative representation of vulnerable plants.
Results of the ‘Land Use’ component
Deforestation activities add synergistically to the impacts that changes in historical climatic conditions could have on the different ecosystems in the study areas.
The results of the analysis suggest that, in the Peru-Bolivia study area, at least 30% of the surface area has undergone a significant change in vegetation cover over the last three decades.
The vast majority of human interventions took place in the mid-1990s. The most critical points were in the foothills of the Cordillera, specifically in the foothill forest of the southwestern Amazon, and in the high Andean zone of the humid puna in the grasslands (two ecosystems). The percentage of the total area affected is close to 58%.
In the Colombia-Ecuador study area, the deforestation scenario is even more critical. There, the ecosystems most affected in the most recent decade were the piedmont rainforest (79% of the affected area) and the low montane rainforest of the Northern Andes (66%). For a total of four of the seven ecosystems analyzed, more than 50% of the area underwent a significant change in vegetation cover in the last three decades.
Results of the comprehensive analysis of the three components
For each of the two study areas, a multi-criteria decision analysis (MCDA) was applied with the aim of integrating the results of the different components of this project (climate change, land use change, biodiversity vulnerability) for an assessment of biodiversity risks at the ecosystem level in the face of global change.
For the Colombia-Ecuador study area, the weighted average representing the highest degree of risk from global change (4.2 on a scale of 1 to 5) was obtained for the northern Andes rainforest ecosystem. This ecosystem obtained the highest score for four of the six criteria: reduction in humidity, land use change, greater relative representation of plants and coprophagous beetles vulnerable to climate change. The next ecosystem, although with a substantially lower degree of risk (weighted average of 3.3), is the low montane rainforest of the Northern Andes. Details of the multi-criteria analysis are shown in Table 1.
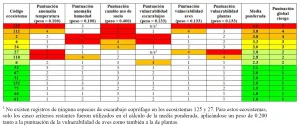
For the Peru-Bolivia study area, the weighted average representing the highest degree of risk from global change (4.8 on a scale of 1 to 5) was obtained for the high Andean grassland ecosystem of the humid puna. This ecosystem obtained the highest score for four of the six criteria: temperature increase, land use change, and greater relative representation of plants and birds vulnerable to climate change. The two ecosystems that follow are the high Andean shrubby grassland and the Yungas montane rainforest, and the foothill forest of the southwestern Amazon (weighted average of 3.8 for both). Details of the multi-criteria analysis are shown in Table 1.
Table 1. Matrix of the multi-criteria analysis for decision-making for six criteria and seven ecosystems in the Colombia-Ecuador study area. For each criterion, the ecosystems were scored on an ordinal scale from 1 to 5 (1 being the lowest degree of severity and 5 the highest), dividing the range of values observed for each criterion into five equal intervals. The same procedure was used to obtain the overall severity (risk) score based on the weighted average.
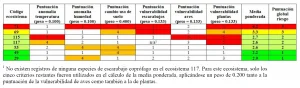
Table 2. Multi-criteria decision-making analysis matrix for six criteria and 15 ecosystems in the Peru-Bolivia study area. For each criterion, ecosystems were scored on an ordinal scale from 1 to 5 (where 1 is the least severe and 5 is the most severe), dividing the range of values observed for each criterion into five equal intervals. The same procedure was used to obtain the overall severity score based on the weighted average.
Legend for ecosystem codes (PDF)
Dissemination products

Click here to download the PDF file (available only in Spanish)
Who we are

The tropical Andes are among the most biodiverse areas on the planet, as they are home to a wonderful variety of ecosystems. It is estimated that Colombia, Ecuador, Peru, and Bolivia, countries that are part of this region, are home to one-sixth of the world’s biodiversity. Unique environments such as the high Andean forests of Polylepis are among the most threatened ecosystems in South America.

The high levels of biodiversity in the tropical Andes are possible thanks to the specific and unique climatic and orographic conditions of the region. High-altitude environments behave like islands where endemic species develop and survive without the possibility of migrating or mixing with other populations.

Global warming appears to be occurring more rapidly in highlands than in lowlands. The tropical Andes therefore need conservation strategies adapted to their rapidly changing environment.

Although there are few weather stations in the tropical Andes, analysis of their historical records and other sources of information allows us to reconstruct past Andean climates in order to better understand the complex climate variability of the region. Our team (pictured) has installed humidity and temperature sensors in the study areas and collected data for a period of at least two consecutive years.

Colombia, Ecuador, Peru, and Bolivia cover approximately 2.4% of the Earth’s land surface and 21% of South America, but they are home to almost a fifth of the world’s flora and more than half of the flora of the South American continent, with endemism rates in each country close to 25-30%.

In the Andes of Colombia, Ecuador, Peru, and Bolivia, from the foothills to the snow line, there are more than 2,000 species of birds, about 22% of all known species. Nearly 600 of them are found nowhere else on Earth. Birds play very important roles in the functioning of Andean ecosystems, such as seed dispersal and pollination.

Insects are a predominant component of global biodiversity. The tropical Andes are a center of speciation for many insects, which has led to exceptional levels of diversity and endemism in this region. Coprophagous beetles are considered excellent bioindicators, and with their role as decomposers, nutrient recyclers, pest controllers, and secondary seed dispersers, they contribute to the proper functioning of ecosystems.

The tropical Andes have been a center of human development for more than 10,000 years and constitute one of the 12 main centers of origin of plants cultivated for food, medicine, and industry worldwide. Their human societies, which have had varying impacts on the region’s landscapes and diversity, depend in many ways on the goods and services provided by Andean ecosystems.